Find a new home for your Prometheus metrics and Grafana Dashboards outside your Kubernetes cluster in Azure Monitor
Replace your self-hosted Prometheus and Grafana with Azure Monitor, a fully-managed and centralized logging, metrics and dashboard solution without vendor lock-in.


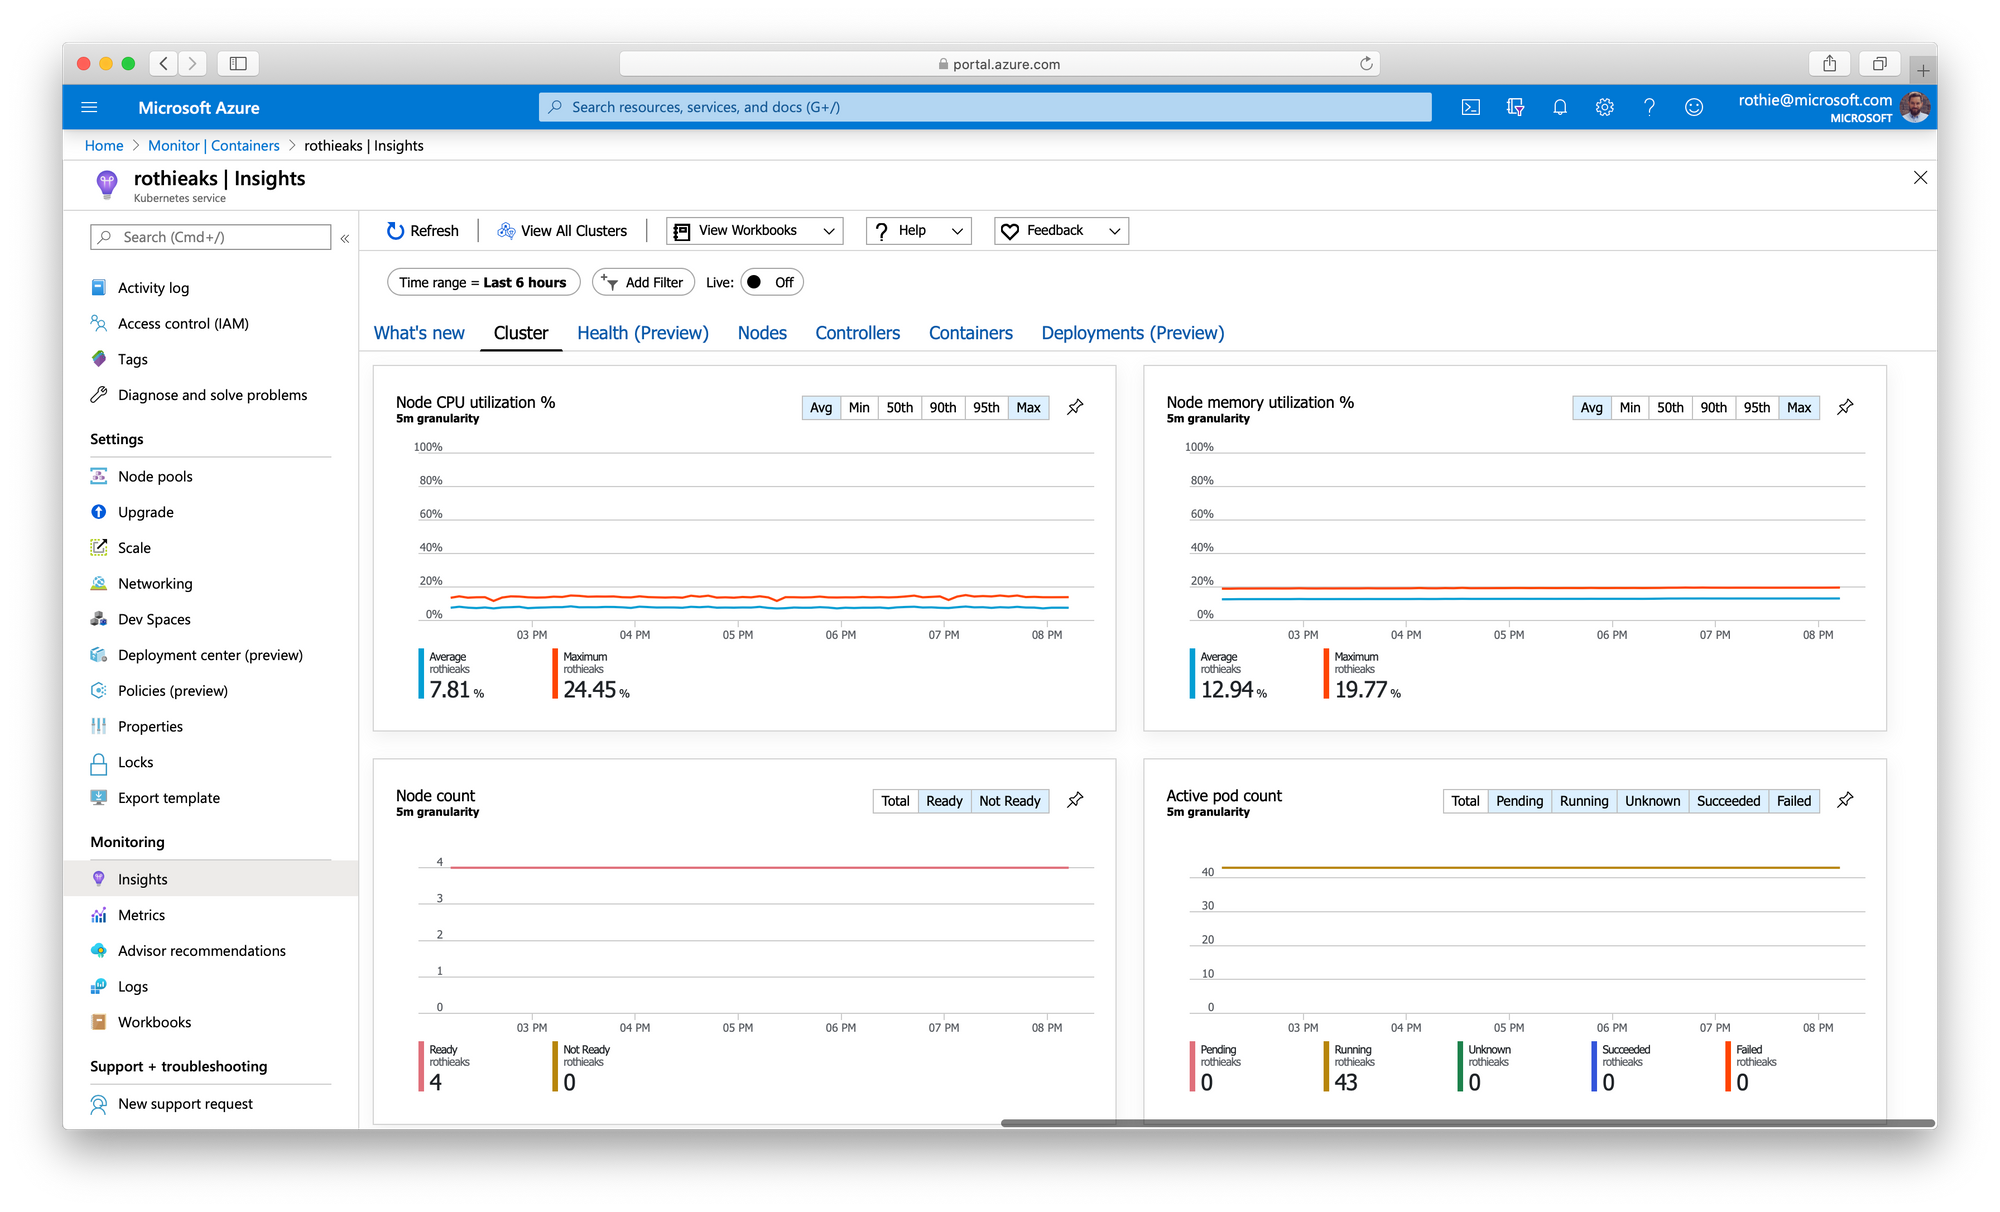
The combination of Prometheus and Grafana seems to have grown to a de facto standard for monitoring Kubernetes clusters in the Cloud Native community. Azure Monitor for Containers is capable of scraping Prometheus metrics and storing them outside your clusters as a managed service. It also allows you to create alerts and dashboard or serve as a data source for Grafana.
Why should you care?
While Prometheus and Grafana are excellent solutions for your metrics, hosting them inside your cluster by yourself can have faws, that you should consider: If your cluster goes down, your logs and metrics goes with it. And so does your best chance of finding our what happened. Also, when you are looking into combining metrics from multiple clusters into one Dashboard, you often end up hosting a dedicated cluster just for dashboard and log storing.
With Azure Monitor, you hand these responsibilities over to Microsoft and free up cluster resources by using a fully managed, scalable solution for storing, analyzing and displaying logs and metrics.
Hint: There is no vendor lock-in, with this solution, as you can always fallback to self-hosted Prometheus and Grafana instances, in case Azure Monitor might not be an option anymore!
What is Azure Monitor?
Azure Monitor combines several logging, monitoring and dashboard solutions across a wide set of Azure resources. It is scalable, fully managed and provides a powerful query language and neat features like alerts, if logs or metrics match specific conditions.
Installation and setup
The good news is, that your application does not have to adopt to these changes at all. It can still expose the same Prometheus metrics. The Azure Monitor agent in the cluster can be configured to scrape Prometheus style metrics.
To monitor a Kubernetes cluster, we need to install the Azure Monitor Agent as a Daemon Set to each node. If your Kubernetes cluster is a managed Azure Kubernetes Service (AKS) one, you can deploy the Azure Monitoring agent to your cluster by enabling the Monitoring extension.
az aks enable-addons \
  --addons monitoring \
  --name CLUSTER_NAME \
  --resource-group RESOURCE_GROUP
For other types of Kubernetes clusters like self-hosted ones or Red Hat OpenShift, follow the official onboarding instructions.
Once installed, the Azure Monitor agent starts collecting various Kubernetes stats. By default it doesn't scrape Prometheus metrics, but it can be enabled by applying a Config Map. You can start by downloading the configuration template and adjust it to your requirements.
curl https://raw.githubusercontent.com/microsoft/OMS-docker/ci_feature_prod/Kubernetes/container-azm-ms-agentconfig.yaml > container-azm-ms-agentconfig.yamlTo enable Prometheus scraping, edit the file and make sure to activate metric scraping from your Pods flag in the Config Map. You should also take a look at the detailed documentation of the different options, if you want to fine-tune the configuration.
# ...

prometheus-data-collection-settings: |-
monitor_kubernetes_pods = trueOnce updated, apply the edited template to your cluster.
kubectl apply -f container-azm-ms-agentconfig.yamlHow to query metrics and create Dashboards?
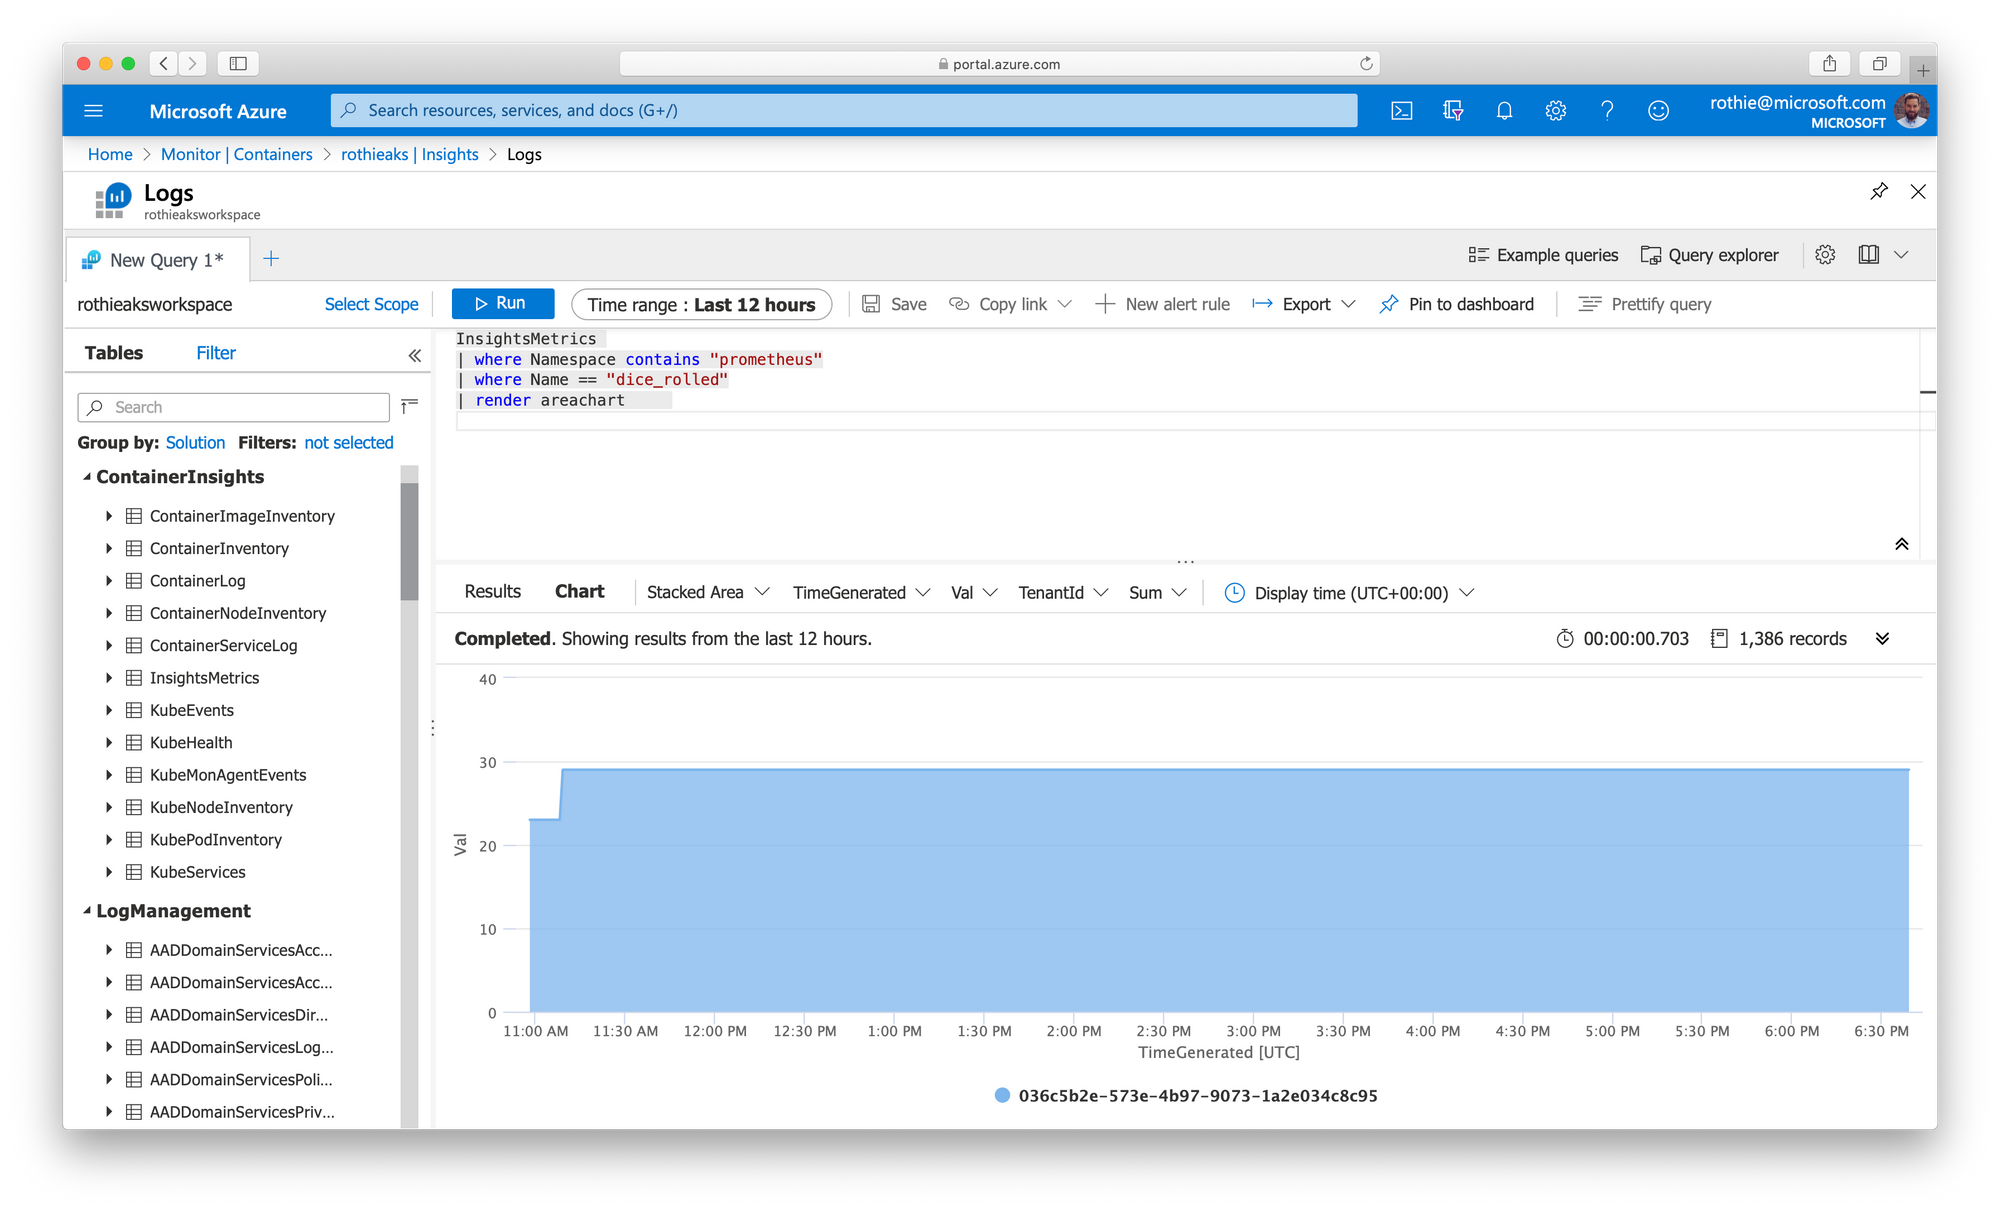
Shortly after configuring the Azure Monitor agent in your cluster to also scrape Prometheus logs, they will show up in the Log section of Azure Monitor in the Azure Portal. After selecting your Kubernetes cluster as the scope, you can start querying your logs and metrics and displaying them as charts and tables.
InsightsMetrics
| where Namespace contains "prometheus"
| where Name == "dice_rolled"
| render areachartFrom here you can also create alert rules to get notified whenever your something occurs that you find worth getting a notification for. Also, you can pin the graphs you are creating to your Azure Dashboards, to share them with the team.
In conclusion, Azure Monitor for containers can be a good solution for storing your logs and metrics outside of your cluster in a managed and centralized place. This is not only beneficial for freeing up cluster resources but also for not losing access to your logs and alerts, in case a cluster goes down. Azure Monitor can scrape native Prometheus metrics, so there is no vendor lock-in and you can fall back to hosting your own Prometheus and Grafana in case you have to.
Gotchas
Although it has a Grafana Plugin, Azure Monitor does not expose its metrics in the same format as Prometheus does. This has the consequence that you might have to rebuild your Grafana dashboards, when moving from self-hosted Prometheus to Azure Monitor and most standard dashboards won't work for you out oft the box. I have posted a Feature Request for PromQL support to the Azure Monitor Feedback page, that you can vote for.
☝️ Advertisement Block: I will buy myself a pizza every time I make enough money with these ads to do so. So please feed a hungry developer and consider disabling your Ad Blocker.